pst-plot -- examples

| Main page |
|
Index |
| Bug list |
| Documentation |
| Doc errors |
| Examples |
| 2D Gallery |
| 3D Gallery |
|
Packages
|
|
References
|
|
CTAN Search CTAN: Germany USA |
|
Statistics |
|
Extended translation of the the 5th edition |
|
the 7th edition, total of 960 colored pages |
|
2nd edition, 212 pages, includes 32 color pages |
|
 |
|
 |
|
 |
|
 |
|
 |
|
|
|
|
|
 |
|
 |
The following plots were produced with the packages pst-plot, which is part of pstricks. The plot-package always requires the corresponding tex-file pst-plot.tex. You can download Plotting functions from the DTK, the journal of DANTE, and also Plotting data records (english) (german)
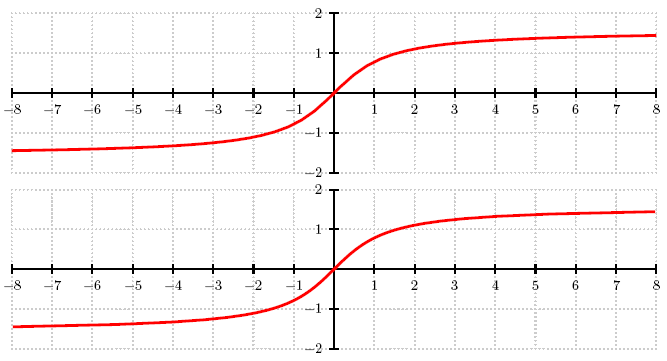
The inverse function of tan(x), the atan(x), has the syntax
y=atan(nominator/demoninator) and the values are in the range of 0..360°.
This is in difference to the default definition of -90...+90°. The following example
shows also a plot with the \parametricplot macro. For the plot of a tan(x) go
here
|
 |


|
|
You need package pstricks-add. For
another (better) solution see also package pst-func.
|
|
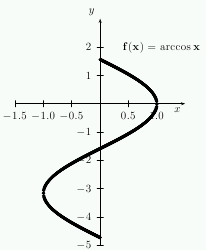
To plot the inverse function of cos(x), the arccos(x) is easier to plot with the
parametric macro instead of the psplot macro.
|
|
| This examples shows an extremely number of plotted points. The first plot has 3000 and the second one 4000, divided in two intervals of 3000 and 1000. This example shows, that there are nearly no restrictions in setting the plotpoints=??? option. Download the LaTeX Source for more information. |

|
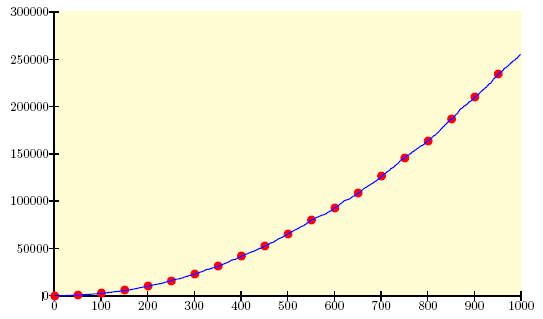
The data file holds 1000 data records, but only every nth
should be plotted. There is a new option step.
This example shows two curves, the blue one shows every data record and the
red one only every 50th record.The option step is only valid for the \listplot macro, so
that the datafile has to be read before by the \readdata macro.
|
 |
|
|
| Different units |
|---|
 |
|
|