pst-plot -- Data examples

| Main page |
|
Index |
| Bug list |
| Documentation |
| Doc errors |
| Examples |
| 2D Gallery |
| 3D Gallery |
|
Packages
|
|
References
|
|
CTAN Search CTAN: Germany USA |
|
Statistics |
|
Extended translation of the the 5th edition |
|
the 7th edition, total of 960 colored pages |
|
2nd edition, 212 pages, includes 32 color pages |
|
 |
|
 |
|
 |
|
 |
|
 |
|
|
|
|
|
 |
|
 |
| special plot |
|---|
 |


|
| Label plot | Special plot |
|---|---|
 |
 |
|
|
|
| Special axes values | |
|---|---|
 |
 | -->
|
|
|
 |
Using x/y values from different data files 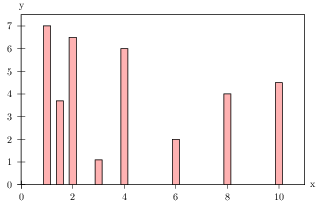 |
|
|
| Gridplot | |
|---|---|
 |
 |
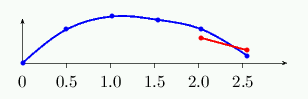
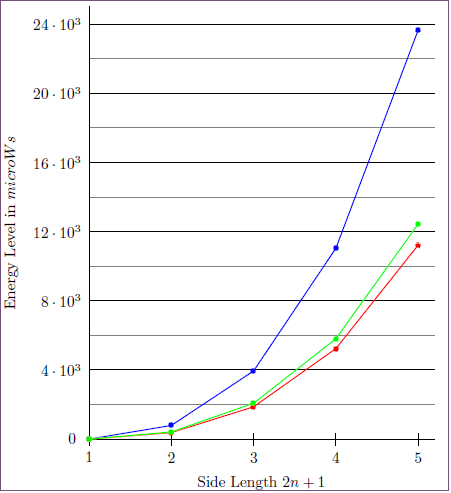
The plotstyle curve needs at least three data records to plot the
values successfully. You'll get a problem when the data file has only two records.
This example counts first the number of data records in the dat macro and then
switches from plotstyle curve to line when only two
data records are present.
|
You need package pstricks-add (>=1.30).
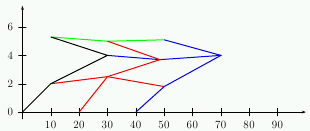
This example plots the data records in a grid like order (matrix). First horizontal line
is from P0 to P2 and the first vertical line is from P0 to P9 a.s.o:
 P9  P10 P11
 P6  P7  P8
 P3  P4  P5
 P0  P1  P2
|
 |
 |
|
|
|
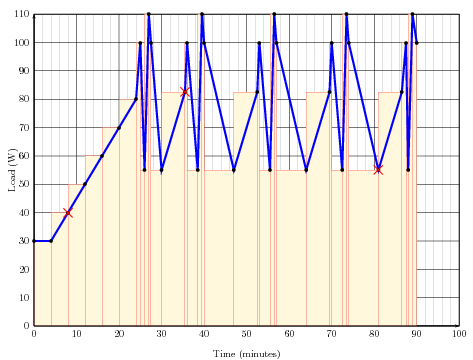
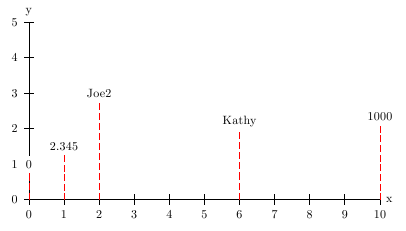
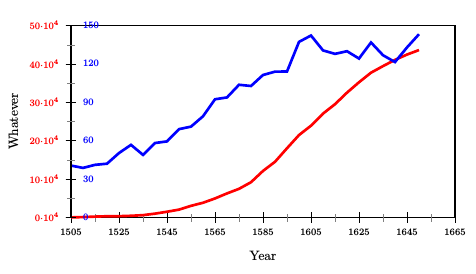
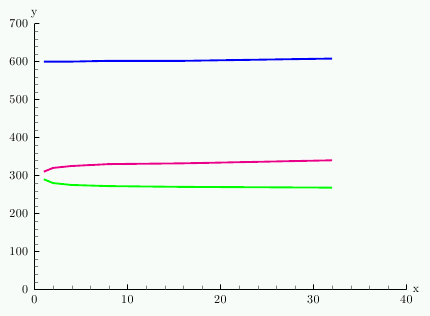
 The data file holds 1000 data records, but only every nth
should be plotted. There is a new option
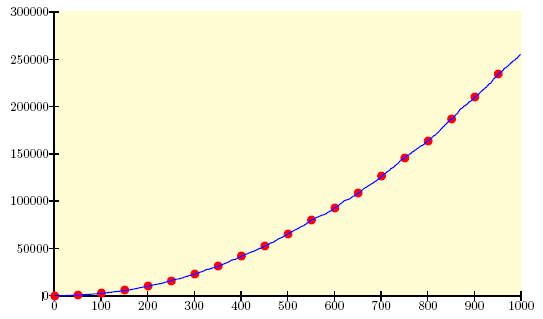
The data file holds 1000 data records, but only every nth
should be plotted. There is a new option step.
This example shows two curves, the blue one shows every data record and the
red one only every 50th record.The option step is only valid for the \listplot macro, so
that the datafile has to be read before by the \readdata macro.
You need the package pstricks-add.
|
 |
 |
|
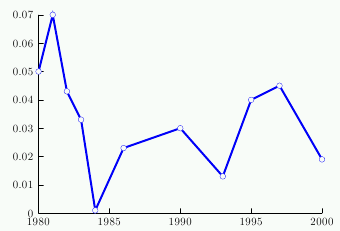
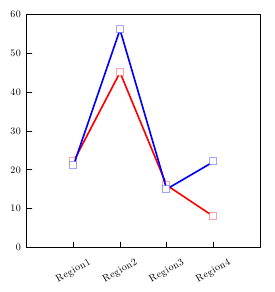
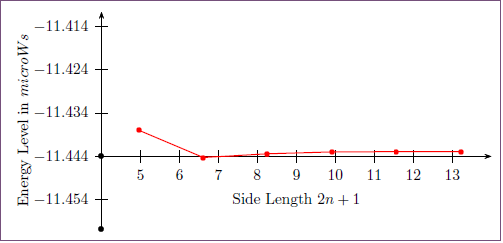
In this example PSTricks does the right scaling for the axes. |
|
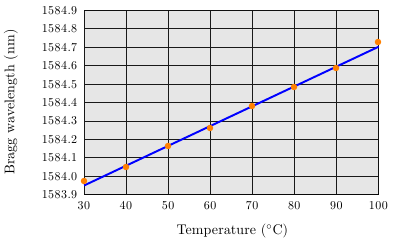
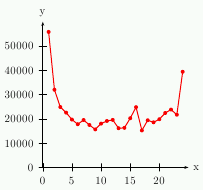
| In this example PSTricks does a multiple value plot, the right scaling for the axes and changes the order of the x values. | |
 |
 |
|
|
|
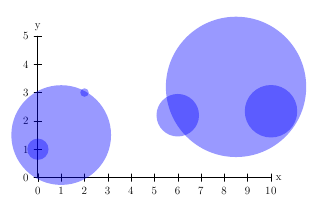
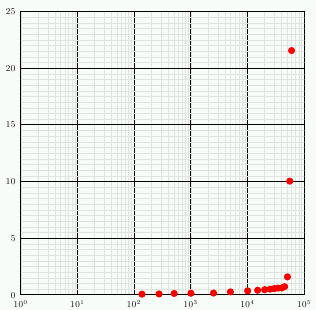
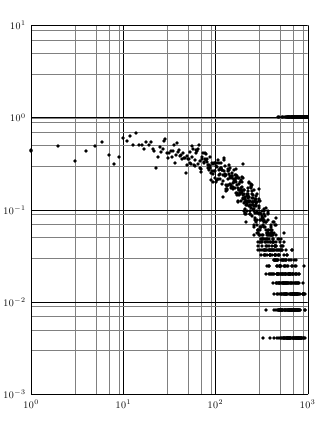
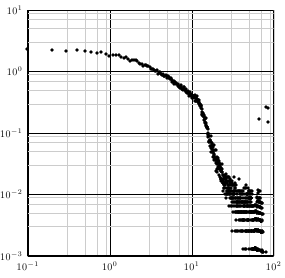
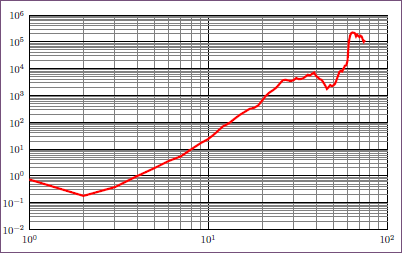
| Logarithmic axes | with zero x and y values | using psgraph for different scaling |
|---|---|---|
 |
 |
 |
|
|

|
|
 |
|
|
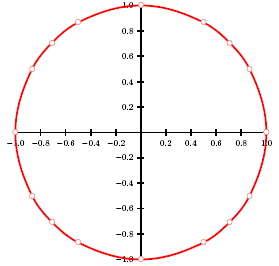
| Polar plot | Adding two column values of data |
|---|---|
 |
 |
|
|
|
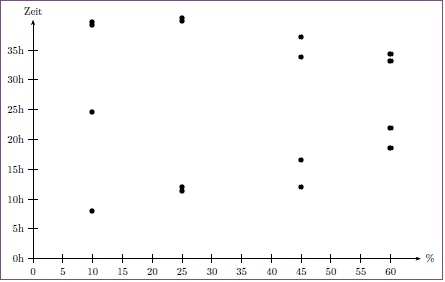 |
data format:
60 21:53 45 16:35 25 11:24 10 8:00 60 18:36 45 12:06 25 12:05 10 24:41 60 33:13 45 33:46 25 39:52 10 39:16 60 34:25 45 37:10 25 40:22 10 39:39 |
|
|