Using PSTricks and TikZ

| Main page |
|
Index |
| Bug list |
| Documentation |
| Doc errors |
| Examples |
| 2D Gallery |
| 3D Gallery |
|
Packages
|
|
References
|
|
CTAN Search CTAN: Germany USA |
|
Statistics |
|
Extended translation of the the 5th edition |
|

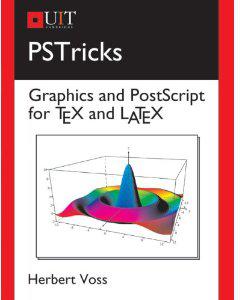
the 7th edition, total of 960 colored pages |
|
2nd edition, 212 pages, includes 32 color pages |
|
 |
|
 |
|
 |
|
 |
|
 |
|
|
|
|
|
 |
|
 |
\documentclass{article}
\usepackage{auto-pst-pdf}
\ifpdf
  \usepackage{tikz}
\else
  \usepackage{pst-plot}
\fi
\begin{document}

\begin{pspicture}[showgrid](4,4)
\psdot[dotscale=10](2,2)
\end{pspicture}

\tikz\draw (0,0) -- (1,3) -- (3,0);

\end{document}
Using lualatex instead of pdflatex makes more sense here:
\RequirePackage{pdfmanagement-testphase}
\DocumentMetadata{}
\documentclass{article}
\usepackage{tikz}
\usepackage{pst-plot}

\begin{document}

\begin{pspicture}[showgrid](4,4)
\psdot[dotscale=10](2,2)
\end{pspicture}

\tikz\draw (0,0) -- (1,3) -- (3,0);

\end{document}