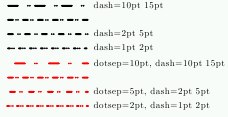
Lines -- examples

| Main page |
|
Index |
| Bug list |
| Documentation |
| Doc errors |
| Examples |
| 2D Gallery |
| 3D Gallery |
|
Packages
|
|
References
|
|
CTAN Search CTAN: Germany USA |
|
Statistics |
|
Extended translation of the the 5th edition |
|
the 7th edition, total of 960 colored pages |
|
2nd edition, 212 pages, includes 32 color pages |
|
 |
|
 |
|
 |
|
 |
|
 |
|
|
|
|
|
 |
|
 |
pst-3d |
Bars as linestyle |
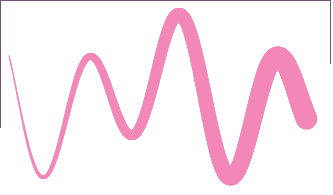
Bezier-Curves |
How a path is build |
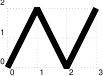
Curves |
Curves around Nodes |
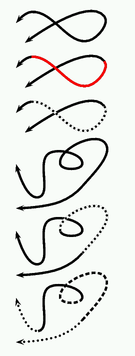
Different Width |
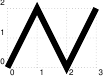
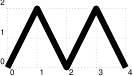
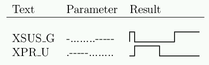
Digital Signals |
Dotted and Dashed |
Double lines |
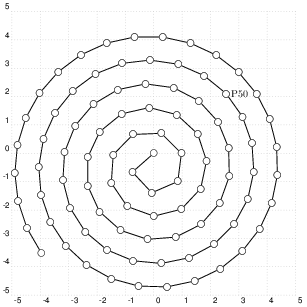
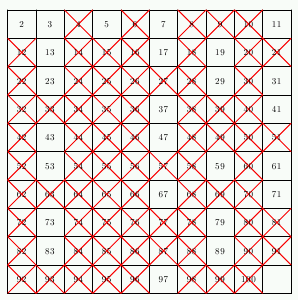
Erathostenes |
Path |
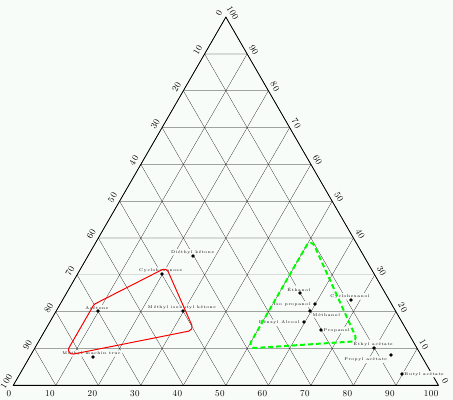
Filled polygons |
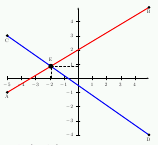
Intersection Points |
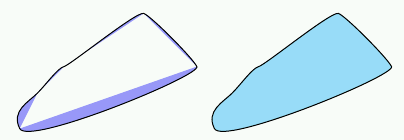
Filled bezier curves |
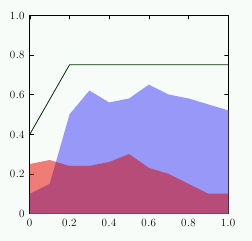
Filled lines |
Knots |
Line ends |
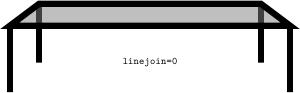
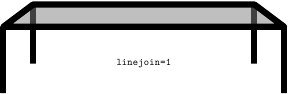
Lineedge |
Line Ends |
Michelson experiment |
Polygons |
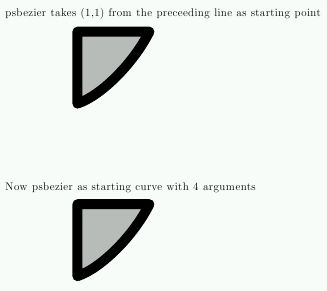
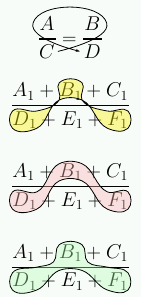
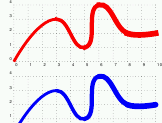
\pscustom and psbezier |
Sieve of Erathostenes |
Variable line width |
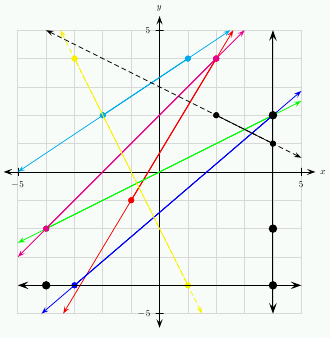
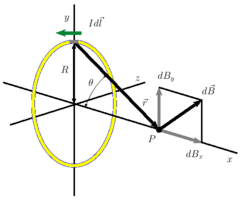
Vectors |
 The packages
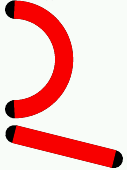
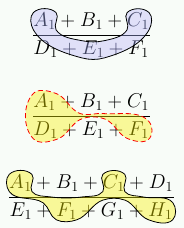
 | \pscustom and \psbezier | |
|---|---|
| to get a filled area colored, use always the first \psbezier curve with four and following ones with with three arguments! | |
 |
 |


|
|
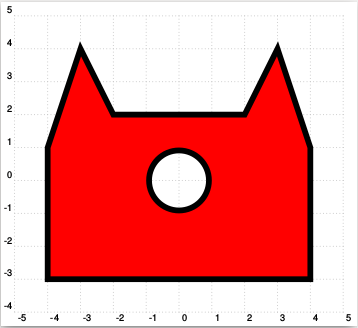
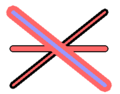
| Filled polygons | ||
|---|---|---|
 |
 |
 |
|
|
|
|
 |
 |
|
|
|
| Lineedge |
|---|
|
|
|
| Curves around Nodes | Variable line width |
|---|---|
|
 |
|
|
|
| Digital Signals | Dotted and Dashed | Different Width | Special double lines |
|---|---|---|---|
 |
 |
 |
 |
|
|
with pstricks-add
|
|
|
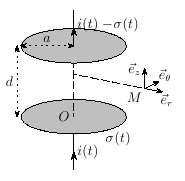
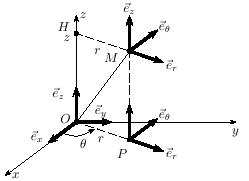
| 3D without pst-3d | ||
|---|---|---|
 |
 |
 |
|
|
|
|
 |
 |
|
|
|
| Sieve of Erathostenes |
|---|
 |
|
|
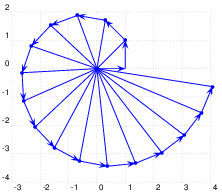
| Vectors |
|---|
 |
|
|